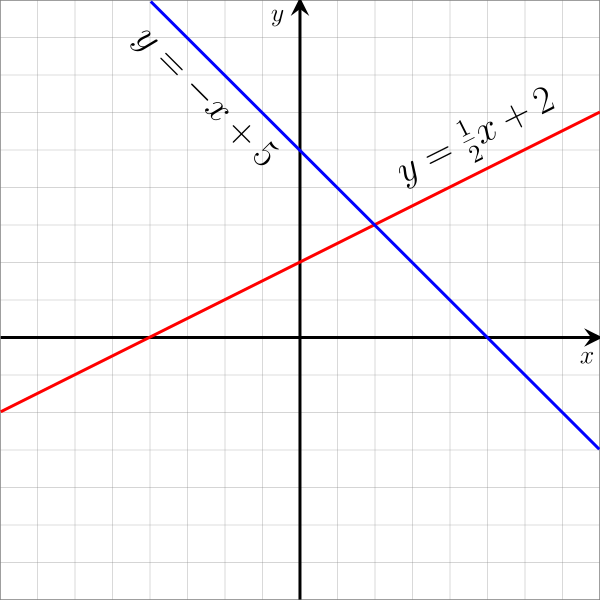
A linear function is a function that can be written in the form:
\(y=ax+b, a \ne 0\)
We can represent linear functions in three different forms of linear equations:
Each of these three forms gives us different useful information about the graph of a linear function, such as its slope, intercepts, etc.
The graph of a linear function is a straight line, representing the linear relationship between the independent and dependent variables.

The slope of a line is a value (often represented as \(m\)) that measures the steepness and direction of a line.
Generally, the slope of a line is defined as:
\(m=\frac{change \ in \ y}{change \ in \ x}\),
also known colloquially as \(m=\frac{rise}{run}\), where rise is the distance between the y-coordinates of two points on the line and run is the distance between the x-coordinates of the same two points.

(Image: http://plaza.ufl.edu/youngdj/slopes/training2.htm)
Note: even though the word "rise" is commonly used, the numerator of the slope can also be a negative value!
We can use the following formula to calculate the slope of a line, given two points \((x_1,y_1)\) and \((x_2,y_2)\) located on the line:
\(m=\frac{y_2-y_1}{x_2-x_1}\)
There are several ways we can graph linear functions, depending on what information about a function is given. We take a look at some of the techniques we can use below, including:
In the case where we are given two points on the line instead of its equation, we can follow two steps to sketch the function:
Solution:
|
1. We first plot the points \(A(-2,-1)\) and \(B(4,3)\) on the xy-plane:
|
2. Finally, we draw the line that goes through or connects both the points:
|
Drag the points \(P\) and \(Q\) and observe how the equation of the line changes. Note: The equation is in slope-intercept form.
Recall that we have an x-intercept/y-intercept at the point where a line intersects the x-axis/y-axis. This means that an x-intercept will have a y-coordinate equaling 0: \((x,0)\). Likewise, a y-intercept will have an x-coordinate equaling 0: \((0,y)\).
When we are given the equation of a line in standard form: \(Ax+By=C\), we can substitute in \(x=0\) and \(y=0\) and find the x-intercept and y-intercept respectively, giving us two points we can use to graph the rest of the line. Then, we can use the same steps from the previous section "Using two points", to graph the line.
Solution:
1. We first find the x-intercept of the line by setting y equals to 0, then solve for x:
\(4x+2(0)=8\)
\(\Rightarrow 4x=8\)
\(\Rightarrow\)\(\ x=2\)
So, the x-intercept of the line is at the point \((2,0)\).
2. Then, we find the y-intercept of the line by setting x equals to 0, then solve for y:
\(4(0)+2y=8\)
\(\Rightarrow 2y=8\)
\(\Rightarrow\)\(\ y=4\)
So, the y-intercept of the line is at the point \((0,4)\).
|
3. We plot both intercepts on the xy-plane:
|
2. Finally, we draw the line that goes through both the points:
|
Change the sliders for \(a\) and \(b\) or drag the points \(P\) and \(Q\).
When we are given the equation of a line in point slope form: \(y-y_0=m(x-x_0)\), we can extract information about a point located on the line and the slope of the line. Specifically, we can use the following steps:
Solution:
1. We can extract information about a point and the slope of this line, giving us the point \((5,-2)\) and the slope \(m=\frac{-2}{3}\).
2. From the slope \(m=\frac{-2}{3}\), we know we have \(rise=-2\) and \(run=3\). So, to find another point on the line, we can either:
Note: Both of the points we found are on the line we are sketching.
|
3. Next, we plot the point from the equation and the point we found in step 2 on the xy-plane:
|
Alternative Step 3: We can first plot the point \((5,-2)\), then use the "rise/run" technique to find the second point directly from the graph (move 2 units down and 3 units right or 2 units up and 3 units left).
|
4. Finally, we draw the line that goes through or connects both the points:

Use the slider to adjust the value of the slope, \(m\), and drag the point \(P\). Observe the changes in the line.
In the slope-intercept form of a linear equation: \(y=mx+b\):
Once we identify these two pieces of information from the equation, we can use the same steps from the previous section 'Using a point and the slope' to graph the line.
Solution:
1. From the equation, we can determine that the slope of the line is \(m=3\) and the y-intercept is at \((0,2)\).
2. From the slope \(m=3=\frac{3}{1}\), we know we have \(rise=3\) and \(run=1\). So, to find another point on the line, we add \(3\) to the y-coordinate of \((0,2)\) and add \(1\) to the x-coordinate of \((0,2)\) to get the point \((1,5)\)
3. Plot the y-intercept and the point we found in the previous step on the xy-plane:

4. Finally, we draw the line that goes through both the points:

Adjust the sliders for \(b\) and \(m\) and see how it affects the graph.