
Most of the two dimensional graphing we do is done on a coordinate plane (often called the Cartesian plane) using a (rectangular/Cartesian) coordinate system. A coordinate plane consists of a pair of perpendicular coordinate lines, called coordinate axes (often labelled as the x and y axes, for the horizontal and vertical axes, respectively), which are placed so that they intersect at the origin.
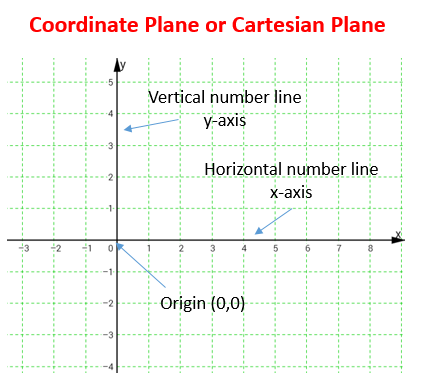
(Image: https://www.onlinemathlearning.com/coordinate-plane.html)
Note: While the labeling of axes with letters x and y is a common convention, any two letters or other labelling may be used. If the letter x and y are used to label the coordinate axes, then the resulting plane is often called the xy-plane.
An ordered pair of real numbers are two real numbers in an assigned order. Every point on a coordinate plane can be associated with a unique ordered pair of real numbers, usually \((x,y)\), also called coordinates. The first value, \(x\), is commonly called the x-coordinate, and the second value, \(y\) is called the y-coordinate.
To plot a point associated with a coordinate on the Cartesian plane, start at the origin which has the coordinates (0,0). Then move x units right or left, depending on whether the x-coordinate is positive or negative, and move y units up or down, depending on whether the y-coordinate is positive or negative.
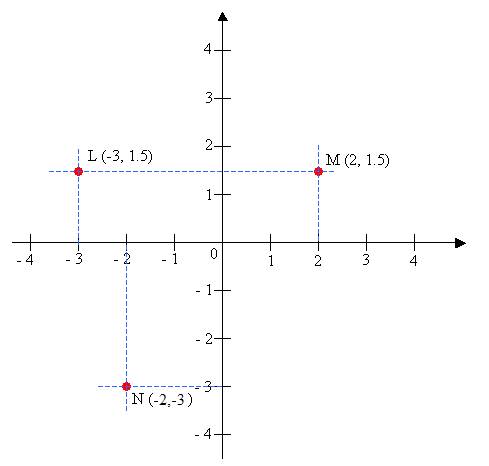
We can label points by writing its "name" before the coordinates, for example the point \(P\) at the coordinates \((0,3)\) can be denoted as \(P(0,3)\). The following diagram demonstrates what some points look like on the Cartesian/xy-plane.
(Image: https://www.onlinemathlearning.com/coordinate-plane.html)
Plotting multiple points associated with ordered pairs creates the foundation of graphing using a (rectangular/Cartesian) coordinate system.
Tip: Make sure to double check the order in which you write coordinates! The x-coordinate always comes before the y-coordinate. For example, the coordinates \((3,4)\) and \((4,3)\) correspond to two different points! (Exercise: Plot these two points to see the difference.)
Intercepts
Points where a graph intersects the horizontal or vertical axes (i.e. the point of a graph that is on the x-axis or y-axis) are called intercepts. If a point intersects the horizontal or x-axis, it is called the x-intercept. Likewise, if a point intersects the vertical or y-axis, it is called the y-intercept.
In a rectangular coordinate system, the coordinate axes divide the plane into four regions called quadrants. These are numbered counter clockwise with roman numerals as shown:

The graph of an equation in two variables x and y is the set of points in the xy-plane whose coordinates are members of the solution set of that equation. In other words, a graph of an equation is made up of all the points (i.e. x and y values) that satisfy that equation. In the Cartesian system, each point on the graph is defined by a pair of numbers, which are written as an ordered pair in the form \((x,y)\). The x value comes from the horizontal axis and the y value comes from the vertical axis.
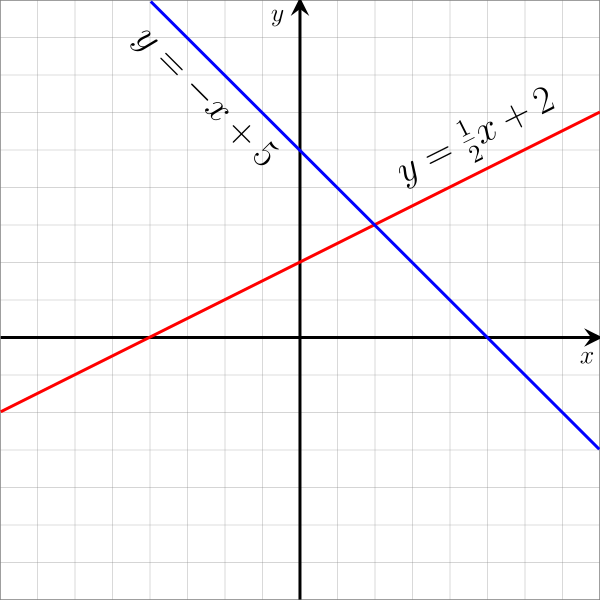
Graphing is useful because a graph can often provide information about the relationship between the independent and dependent variables (usually denoted x and y). For example, given a linear function, we can sketch its graph to find that there's a linear relationship between the variables, i.e. the graph is a line (hence its name linear). See more on graphing linear functions on the Graphing Linear Functions page.
 |
Solution:
First, we determine the x-coordinate by following a vertical straight line down from point \(q\) to the x-axis. In this example, the x-coordinate is 3.

Then, determine the y-coordinate by following a horizontal straight line left from point \(q\) to the y-axis. In this example, the y-coordinate is 2.

Finally, we can write the coordinates in the form of an ordered pair since we now know the x-coordinate is 3 and y-coordinate is 2. So, the coordinates of the point \(q\) is \((3,2)\).
| a) First plotting the point on the Cartesian plane, then determining the quadrant it's located in. |
| b) Analyzing the x and y coordinate values (without plotting the point). |
Solution:
a) First we plot \(M\) on the Cartesian plane. We do so by drawing a vertical line from the x-axis at \(x=3\) and horizontal line from the y-axis at \(y=-4\). Then we plot the point \(M(3,-4)\) where these two lines intersect:
 \(\Rightarrow\)
  \(\Rightarrow\)
Finally, now we can see that the point \(M(3,-4)\) is in quadrant IV.
b) We take a look at the x and y coordinates to determine which quadrant point \(M\) lies in. Since the x-coordinate is positive (\(x=3\)) and the y-coordinate is negative (\(y=-4\)), we have that the point \(M(3,-4)\) is in quadrant IV.